Your Top 5 Storm Center™ Outage Map Questions Answered
July 27, 2020
KUBRA Storm Center™ is an online outage map that provides utility customers with an interactive way to view power outages, check the outage cause and estimated time of restoration, and more. Storm Center uses data from a utility’s outage management system (OMS) to deliver reliable information during uncertain times.
Top 5 Questions
We’ve rounded up the top 5 questions utilities ask when determining if Storm Center is the right outage map for their customers.
1. How is Storm Center different from competing outage maps?
Storm Center sets itself apart from the competition with its superior user experience, backed by comprehensive user testing. KUBRA puts a strong emphasis on creating a user-friendly map with self-service features for seamless customer experiences.
These self-service features include the ability to:
- Check the status of a power outage
- Report power outages via the Outage Reporting and Status Tool
- View planned outages
- View the number of customers affected by an outage
- Receive a summary of outages by location
- View alert banners that display timely information directly on the map
The map supports English, Spanish, and French, and it is WCAG 2.1 AA compliant, which allows visually impaired customers to access outage information.
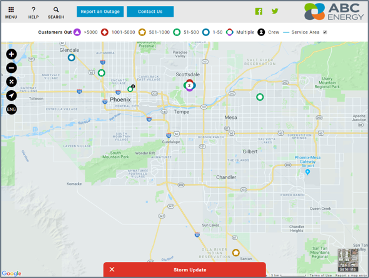
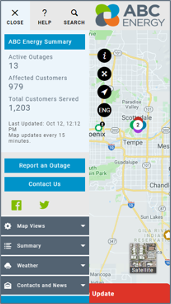
Storm Center Desktop and Mobile Layouts. Other layout options are available.
2. Is the Storm Center map customizable?
Storm Center has extensive configuration options. These options are determined during initial implementation meetings between KUBRA and the utility. Some examples of available configuration options are:
- The type of information included on the map (county, Zip code, city, legislative district, etc.)
- Branding/logo options
- Map button text, hyperlinks, and placement
- Social media icons and placement
- Tool panel content (menu, help/information, and search/bookmarks)
- Number of zoom levels that are allowed on the map (e.g. to prevent users from zooming into street-level detail)
3. What security measures does Storm Center have in place?
Every Storm Center client has unique restrictions on the type of information they want to be publicly available. To ensure security, Storm Center was programmed to evaluate whether or not the data being requested by the map user is publicly accessible information. If the requested data is restricted to private access only, all APIs expect a standardized pre-signed token to establish the requester's right to access the data, making data only available to authorized users.
4. Does Storm Center provide analytics for admin users?
Storm Center provides analytics for map usage. Data is collected from the utility’s Storm Center web page to report pages visited, user’s language preference, browser version, and the device and operating system used to access the site.
These analytics help utilities understand:
- The number of customers accessing the map (especially during storms, when traffic is high)
- How frequently users are accessing the map
- The percentage of users accessing the map from a desktop computer, a smartphone, or a tablet
- What features are being used on the map, including configurable button links
5. Do you have evidence of positive results shown by Storm Center?
Yes, we have a number of clients that have seen positive results. One example is National Grid, an electricity and natural gas delivery company serving 7 million customers in the Northeast. After implementing Storm Center, the region experienced strong winter storms. Storm Center proved successful, as the map was the top-viewed page on its website during the storm's peak. This was also the first storm in National Grid history to have more outages reported online than through the call center. The outage map was also instrumental in alerting customers to supply truck locations during the storm. National Grid distributed more than 5,000 pounds of dry ice and 670 water cases in two days—a record number for National Grid as a result of Storm Center.
On February 7, 2020, a widespread thunderstorm hit the Northeastern United States with freezing rain, snow, and winds. The storm left approximately 850,000 homes and businesses without power across the region. On February 7 alone, Storm Center maps experienced a staggering usage spike with millions of hits from customers across the Northeast. In Massachusetts, where 65,000 customers were affected, a local utility received almost 150,000 visitors and 850,000 interactions to their Storm Center map. This was more than a 3250% increase in map visits from the previous day.
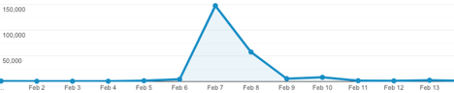
Massachusetts utility map spikes to nearly 150,000 visitors during the storm—a 3250% increase from the previous day.
Learn more about KUBRA Storm Center to determine if it’s the best outage map for your utility. Don’t forget to view our Outage Map Checklist to ensure your outage map is up to par with the best outage maps while you’re at it.]